
The Task Manager is a powerful tool that provides valuable information about the apps and processes running on a PC. It allows users to determine the resource usage of each process and judge the overall health and performance of the computer.
In this article, we will explore the information available in the Task Manager, which includes CPU and GPU load, Windows services, I/O details, and the users logged in.
The Task Manager displays this information both in summary and detailed modes, with ten tabs in total, including three main menu tabs and seven additional tabs. We will delve into each of these tabs and explain the information available in detail.
In This Article
KEY TAKEAWAYS
- The Task Manager is packed with valuable information and detailed statistics about the apps and processes running on the PC.
- This easy-to-use tool displays information about the CPU, GPU, main system memory, network, and the different disks of the PC.
- This useful tool also shows the apps that start when you switch on your PC.
- The details shown by this tool helps to determine the resource used by each process and judge the overall health and performance of the PC.
- The Task Manager displays the information both in a summary mode as well as in a detailed mode.
What Does Task Manager Show?
Usually, the Task Manager shows ten tabs in total. It includes three main menu tabs and seven other additional tabs, and each of them offers a diverse set of information.
Technically, it displays all necessary information about what is going on in your PC ‘right now.’ It includes every minute detail along with the usage of CPU time in seconds as well as other resources by each individual app and process.
Among a host of other information, some of the major ones displayed by the Task Manager include:
- CPU and GPU load
- Windows services
- I/O details
- Commit charge
- The users logged in
Now, take a look at the details.
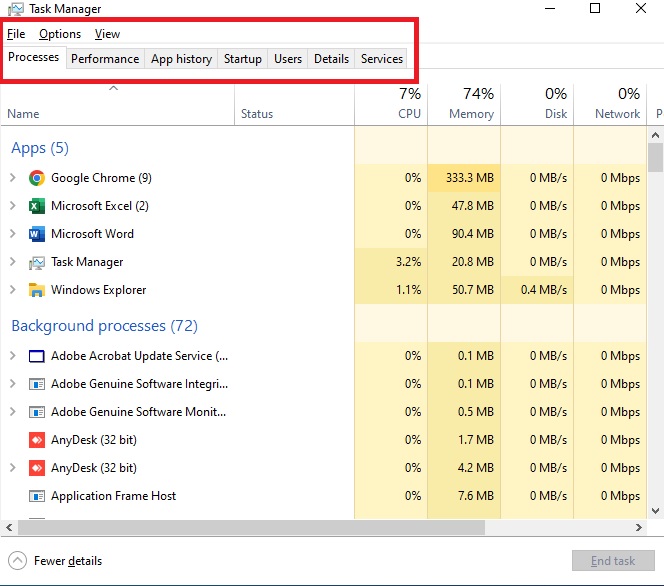
The main menu tabs of the Task Manager are:
- File
- Options or Settings
- View
And the other tabs are:
- Processes
- Performance
- App History
- Startup
- Users
- Details
- Services
Here is the list of things you can see in each of the tabs in the Task Manager, depending on the version of the Windows operating system.
The Main Menu Tab
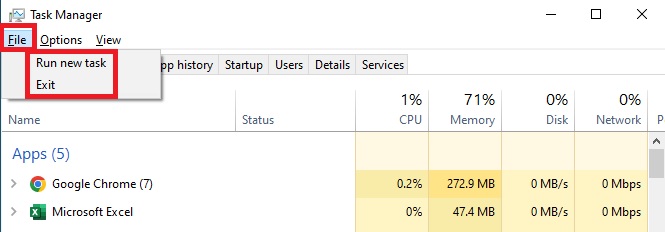
When you left-click on the File menu, you can see the following:
- Run new task
- Exit
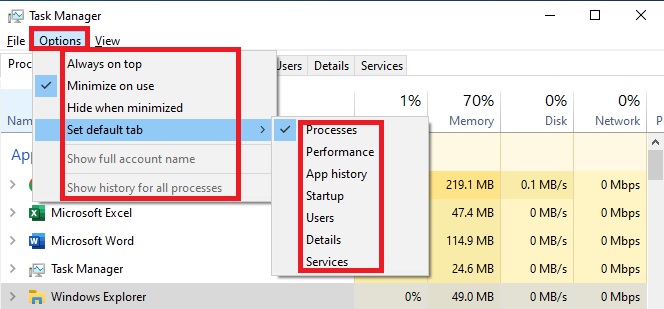
In the Options or Settings menu, you can see the following:
- Always on top
- Minimize on use
- Hide when minimized
- Set default tab to any of the seven available tabs
- Show full account name
- Show history for all processes
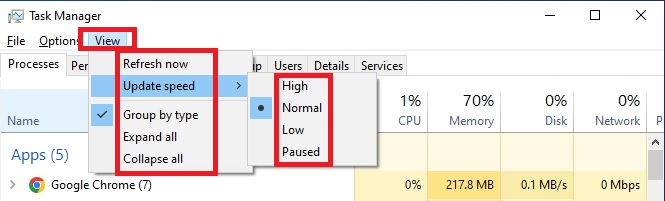
And, clicking on the View menu tab will show you the following:
- Refresh now
- Update speed to High, Normal, Low, or Paused
- Group by type
- Expand all
- Collapse all
Now in each of the subsidiary tabs, normally you can see a host of other things, as explained in detail for each.
The Processes Tab
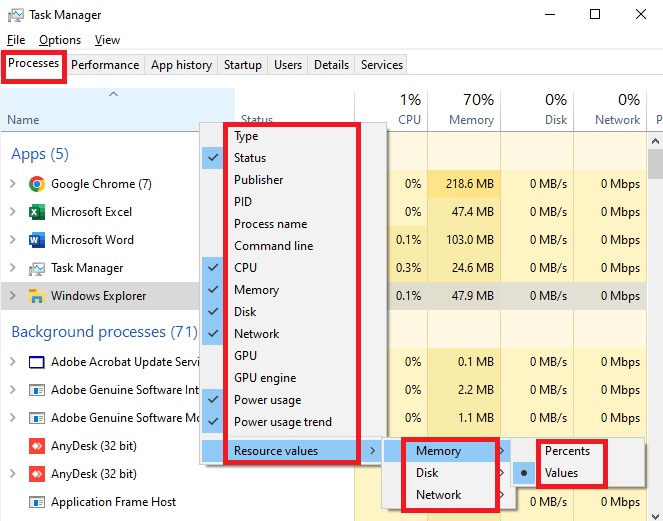
By default, the Processes tab shows the Name, Status, CPU, Memory, Disk, Network, Power usage, and Power usage trend columns.
However, when you right-click on any of the columns of the Processes tab, you will be able to see some additional information, such as:
- Type
- Status
- Publisher
- PID
- Process name
- Command line
- CPU
- Memory
- Disk
- Network
- GPU
- GPU engine
- Power usage
- Power usage trend
- Resource values in Percents and Values for Memory, Disk and Network
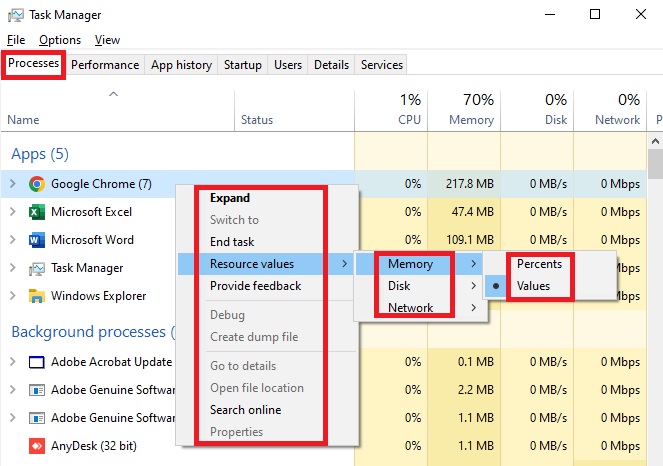
When you right-click on any running process in this tab, some of the options that you will see are:
- Expand/Collapse
- Switch to
- End task
- Resource values with Percents and Values for Memory, Disk, and Network
- Provide feedback
- Debug
- Create dump file
- Go to details
- Open file location
- Search online
- Properties
The Performance Tab
There are different items displayed in the Performance tab. When you view each of them, you will get a lot of information.
CPU
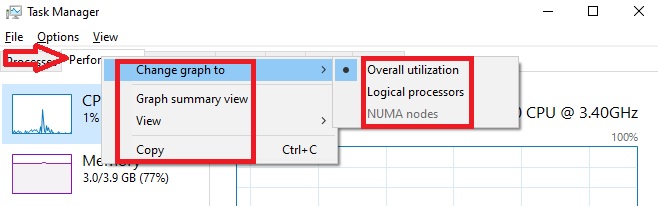
When you right-click on the Performance tab or anywhere on the right side of the window while selecting CPU, you will see the following options:
- Change graph to Overall utilization, Logical processor, NUMA codes
- Graph summary view
- View the CPU, Memory, Disk, Network, GPU
- Copy
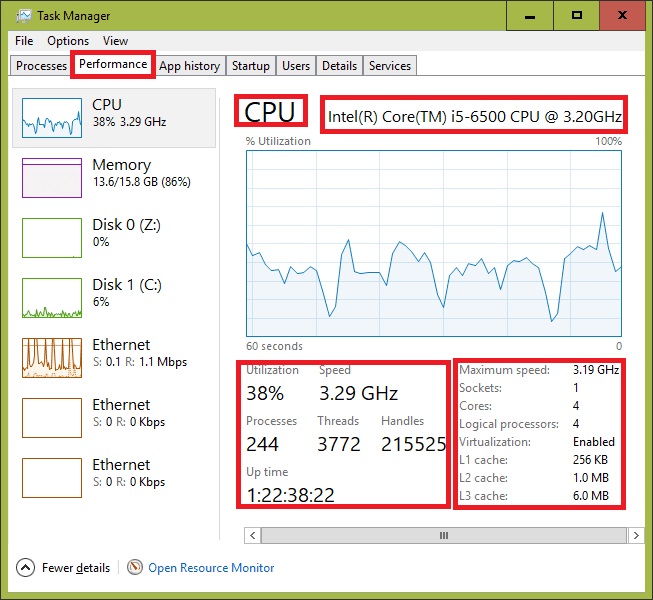
Apart from the name of the processor installed on your computer, the information about the CPU will be displayed in two sections.
The continuously changing numbers in the larger font will tell you about the following:
- Utilization
- Speed
- Processes
- Threads
- Handles
- Up time
The other section with fixed numbers will tell you about one or all of the following:
Memory
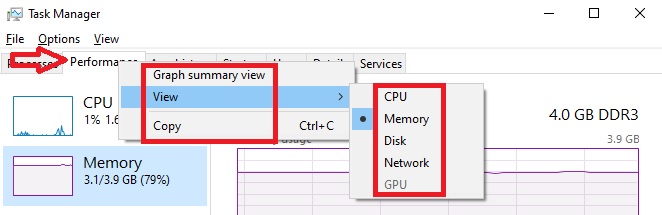
When you select Memory and right-click on the Performance tab or on the right side of the window, you will see the following options:
- Graph summary view
- View the CPU, Memory, Disk, Network, GPU
- Copy
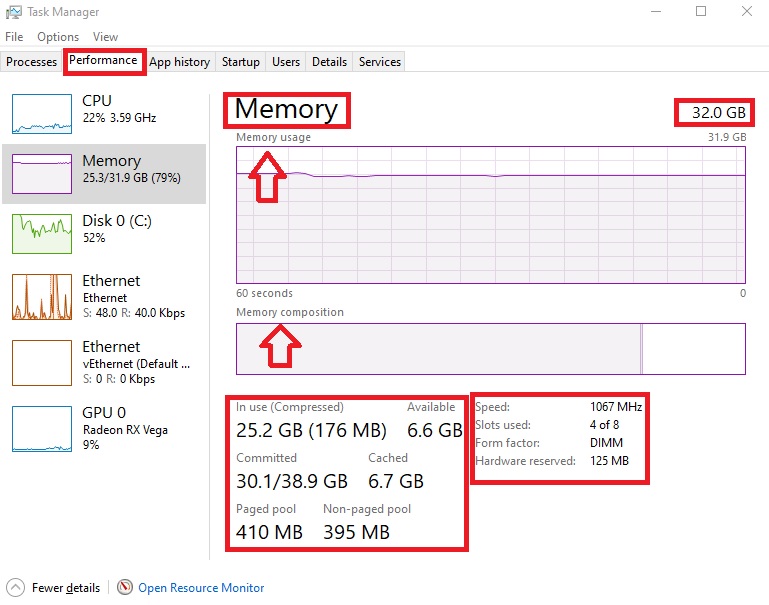
The Memory page in the Performance tab will show you two distinct graphs, apart from the amount of RAM available, namely:
- The Memory usage graph
- The Memory composition graph
You will get two sets of information regarding the memory installed on your system.
Ones with the larger font may change sometimes and include information such as:
- In use (Compressed)
- Available
- Committed
- Cached
- Paged pool
- Non-paged pool
On the other hand, the static information set includes some or all of the following:
- Speed
- Slots used
- Form factor
- Hardware reserved
Disk
You will be able to see the same additional options when you right-click on the Performance tab after selecting Disk as in the case of Memory above.
However, in the Disk option, you will also see the name and type of the disk and two different graphs, such as:
- The Active time graph
- The Disk transfer rate graph
Here again, you will get two sets of data – live and static.
The live data list will include the following:
- Active time
- Average response time
- Read speed per second in MB or KB
- Write speed per second in MB or KB
The other set of static data about the disk will include the following:
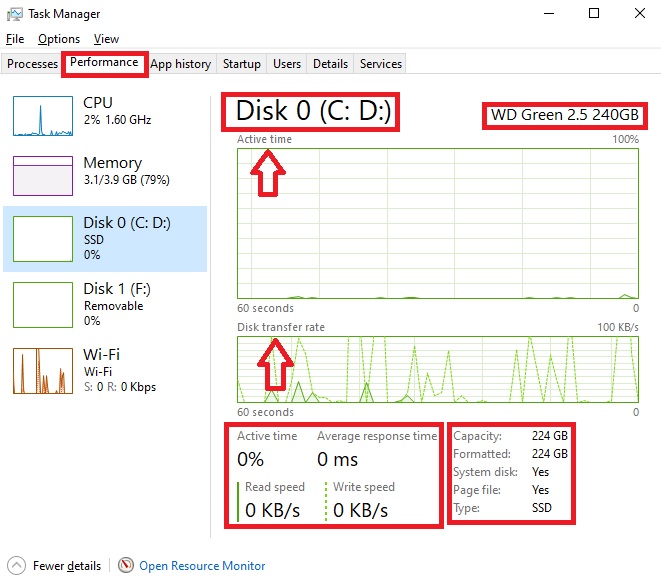
It will show the same for all the drives on your computer system.
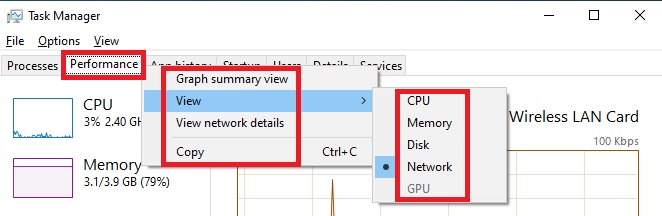
Network
When you right-click anywhere on the right side of the Network window, you will get the following additional options:
- Graph summary view
- View the CPU, Memory, Disk, Network, GPU
- View network details
- Copy
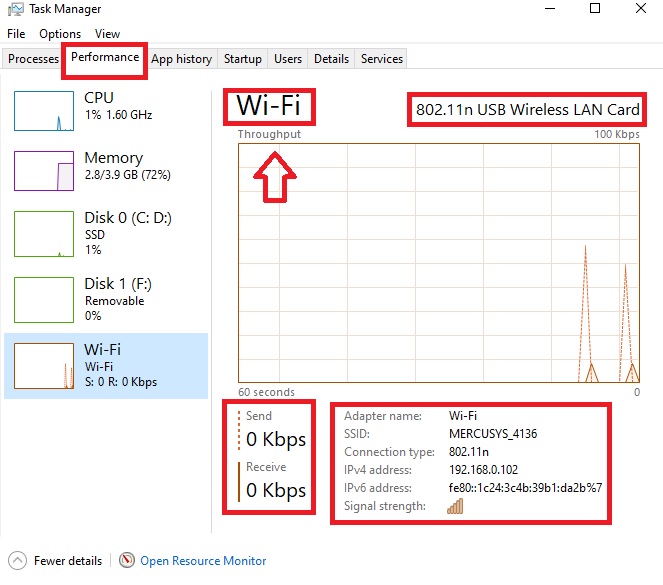
The Network (Ethernet or Wi-Fi) option under the Performance tab will typically show you the Lan card or adapter type and the Throughput graph.
As for the two sets of live and static information, the former will tell you about the data sent or received through the adapter in Kbps, Mbps, or Gbps.
The other useful static information may include some or all of the following:
- Adapter name
- SSID
- Connection type
- IPv4 address
- IPv6 address
- Signal strength
GPU
In the GPU option, the name of the GPU will be displayed at the top-right corner along with several different graphs, such as:
- 3D
- Copy
- Video Encode or Video Processing
- Video Decode
- Shared GPU memory usage and/or Dedicated GPU memory usage
If you look down the window, you will see the necessary information in two specific sections of live and static data.
The live data will show the following:
- Utilization
- GPU Memory
- Shared GPU memory and/or Dedicated GPU memory
On the other hand, the static information will include the following:
- Driver version
- Driver date
- DirectX version
- Physical location
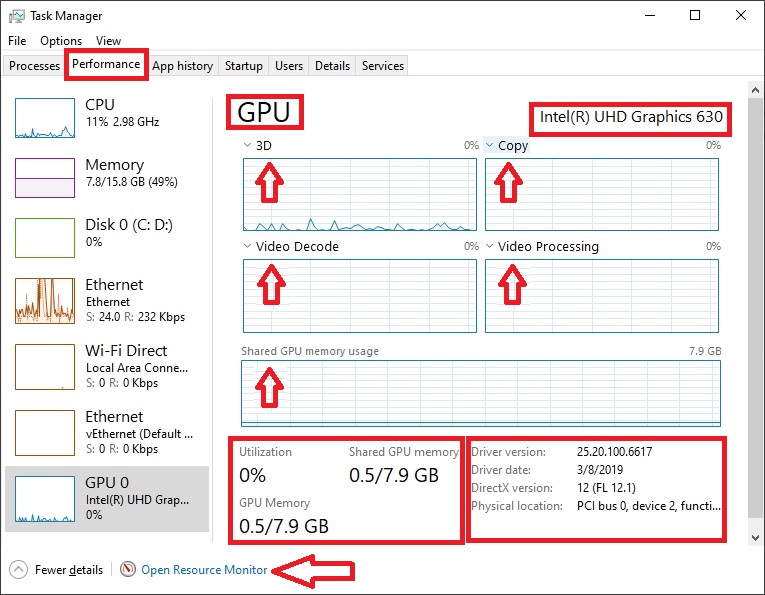
You must have noted that for any option available in the Performance tab there is a shortcut button written in blue located at the bottom of every page, marked by an arrow in the above image. This will take you to the Resource Monitor.
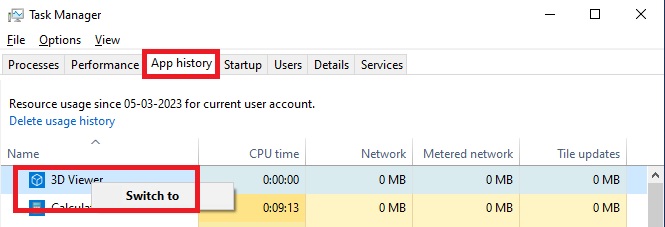
The App History Tab
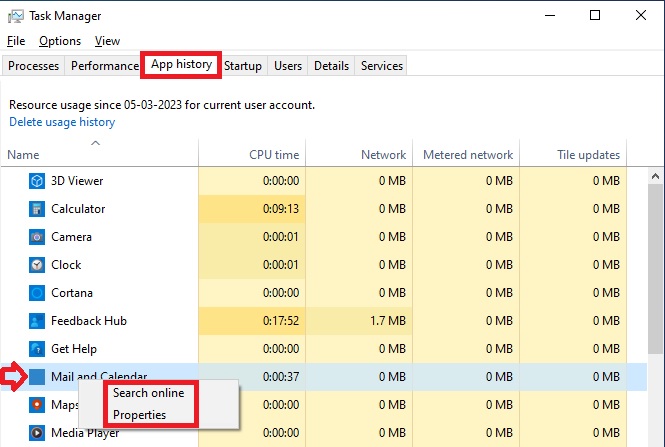
In the App history tab of the Task Manager, you will know about the usage of the resources of the CPU and network by each of the apps.
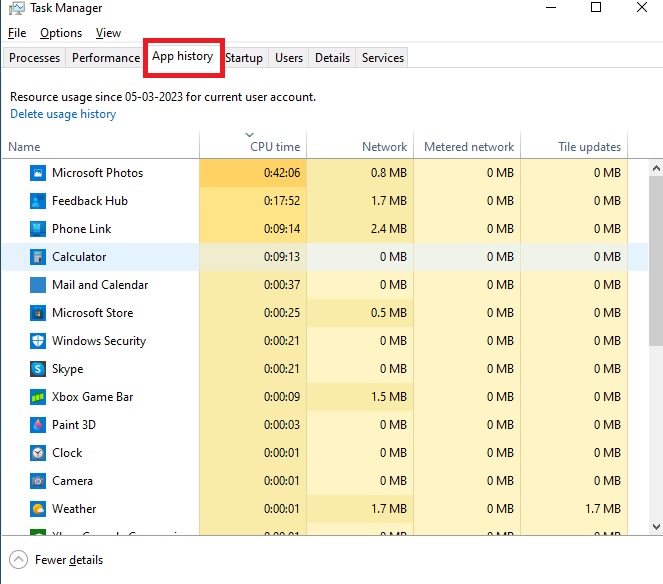
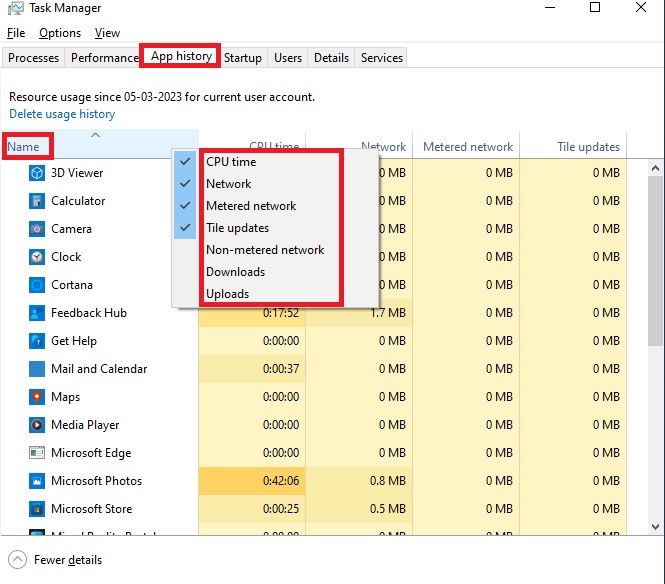
Once again, there will be a few specific columns shown along with the Name in the tab, but when you right-click on any of them, it will show the following additional information for each of the processes or apps running on your PC:
- CPU time
- Network
- Metered network
- Tile updates
- Non-metered network
- Downloads
- Uploads
Depending on the particular version of the Windows operating system, when you right-click on any app or process, you can Switch to it.
And, right-clicking on the non-app process will offer options such as:
- Search online
- Properties
The Startup Tab
In the Startup tab, you will see the Last BIOS time indicated in seconds, which refers to the last startup time of the system.
When you right-click on any process displayed in the list, you will be offered different options, which may vary depending on the type of process you click on. The most common options include:
- Expand/Collapse
- Disable/Enable
- Open file location
- Search online
- Properties
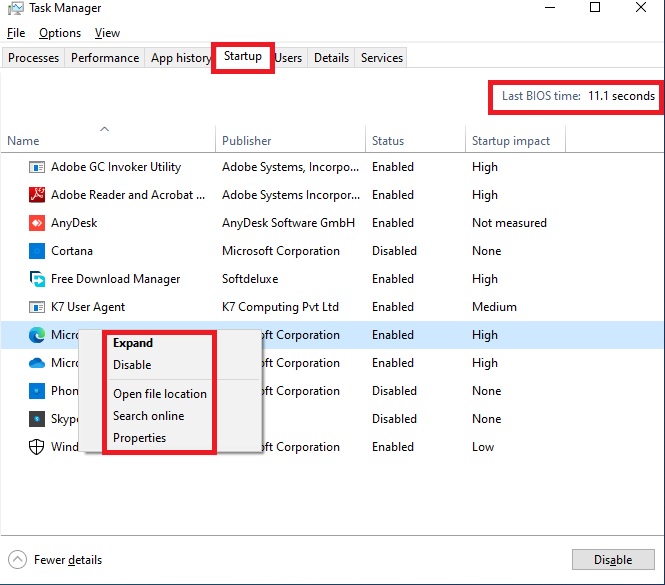
By default, you can see the Name, Publisher, Status, and Startup impact columns in this tab. But when you right-click on any heading, you will be offered some additional information options, such as:
- Publisher
- Status
- Startup impact
- Startup type
- Disk I/O at startup
- CPU at startup
- Running now
- Disabled time
- Command line
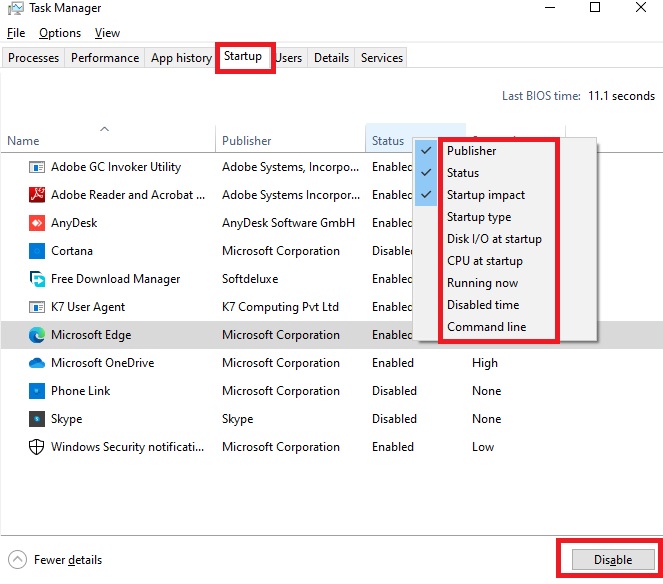
There is a Disable button at the bottom right side, as you can see marked by the red box above, which will allow you to disable any process you want.
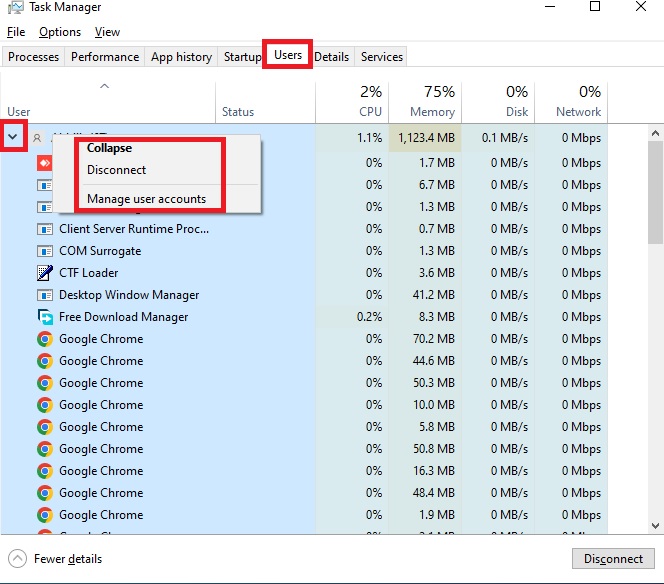
The Users Tab
This specific tab is much similar to the Processes tab. However, the processes are grouped according to the users signed in.
When you right-click on any user in the Users tab, you will get to see the following options:
- Expand/Collapse
- Disconnect
- Manage user accounts
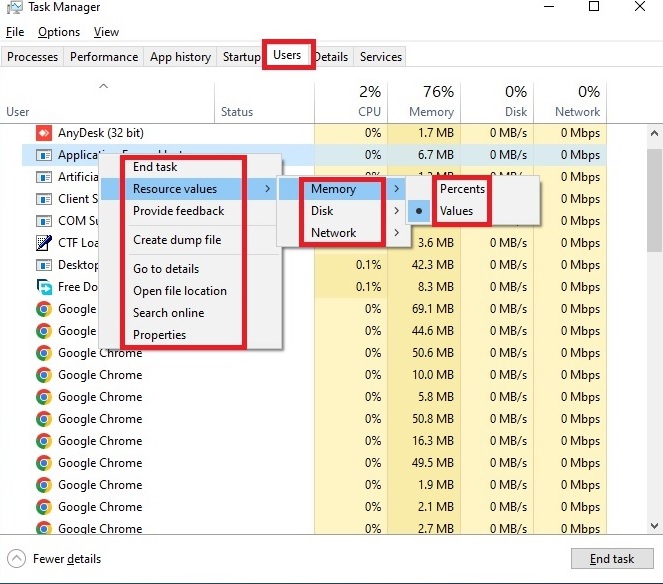
And, when you right-click on any process listed under any user, depending on the process selected, the options you will get include some or all of the following:
- Switch to
- Restart
- End task
- Resource values of Memory, Disk and Network in Percents and Values
- Provide feedback
- Efficiency mode
- Create dump file
- Go to details
- Open file location
- Search online
- Properties
Typically, the tab will show the User, Status, CPU, Memory, Disk, Network, but by right-clicking on any of the headings you can see some additional information options such as:
- ID
- Session
- Client name
- Status
- CPU
- Memory
- Disk
- Network
- GPU
- GPU engine
- Resource values of the Memory, Disk and Network expressed in Percents and Values
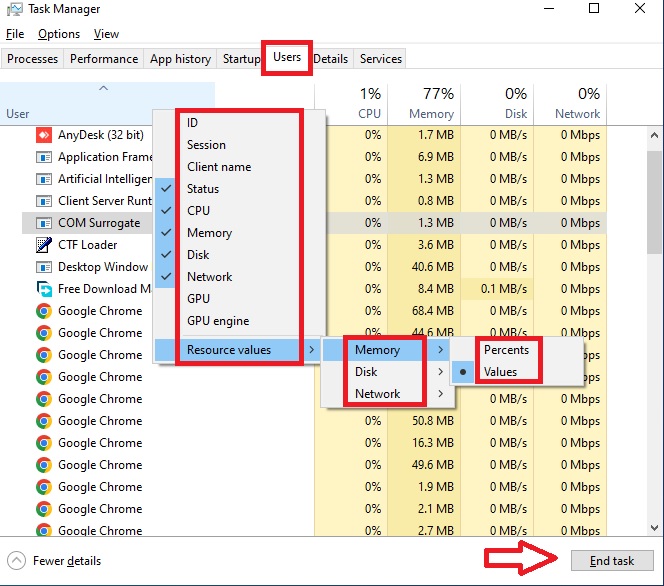
Depending on the Windows version and the process chosen, the button at the bottom right of the tab, marked by the red arrow in the image above, will change to Disconnect, Restart, or End task.
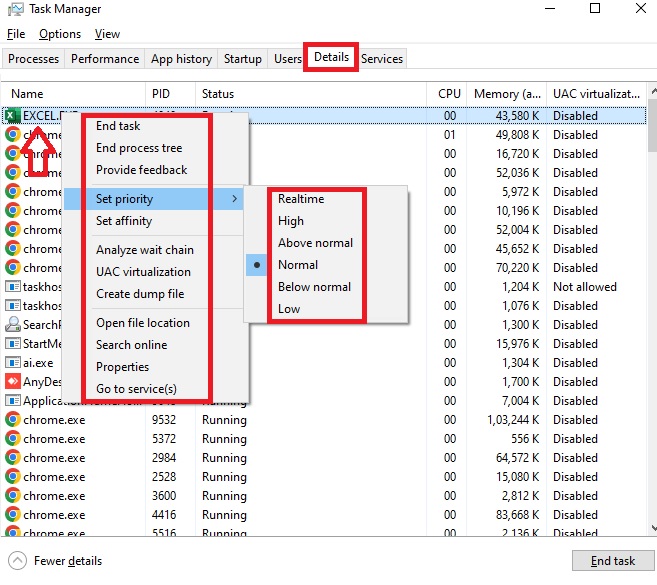
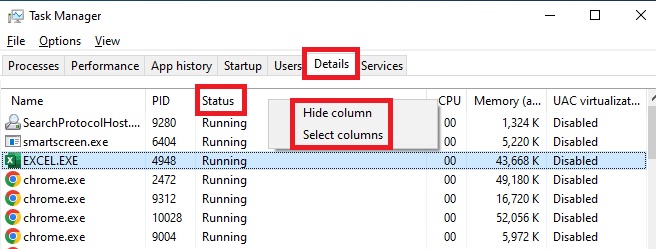
The Details Tab
In the Details tab, when you right-click on any process listed, you will see some or all of the following options, depending on the version of Windows installed on your PC:
- End task
- End process tree
- Provide feedback
- Efficiency mode
- Set priority as Realtime, High, Above normal. Normal, Below normal, and Low
- Set affinity
- Analyze wait chain
- UAC virtualization
- Create dump file
- Open file location
- Search online
- Properties
- Go to service(s)
And, when you right-click on any of the column headings, you will get two options as follows:
- Hide column
- Select columns
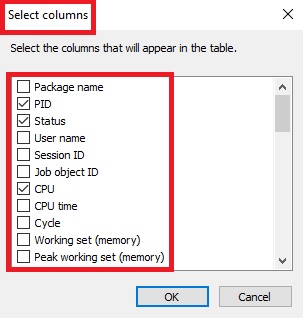
When you choose Select columns, the Task Manager will open a new window with the following options:
- Package name
- PID
- Status
- User name
- Session ID
- Job Object ID
- CPU
- CPU time
- Cycle
- Working set (memory)
- Peak working set (memory)
- Working set delta (memory)
- Memory (active working set)
- Memory (private working set)
- Memory (shared working set)
- Commit size
- Paged pool
- NP pool
- Page faults
- PF Delta
- Base priority
- Handles
- Threads
- User objects
- GDI objects
- I/O reads
- I/O writes
- I/O other
- I/O read bytes
- I/O write bytes
- I/O other bytes
- Image path name
- Command line
- Operating system context
- Platform
- Architecture
- Elevated
- UAC virtualization
- Description
- Data Execution Prevention
- Extended Control Flow Guard
- Enterprise context
- DPI Awareness
- Power throttling
- GPU
- GPU engine
- Dedicated GPU memory
- Shared GPU memory
- Hardware-enforced Stack Protection
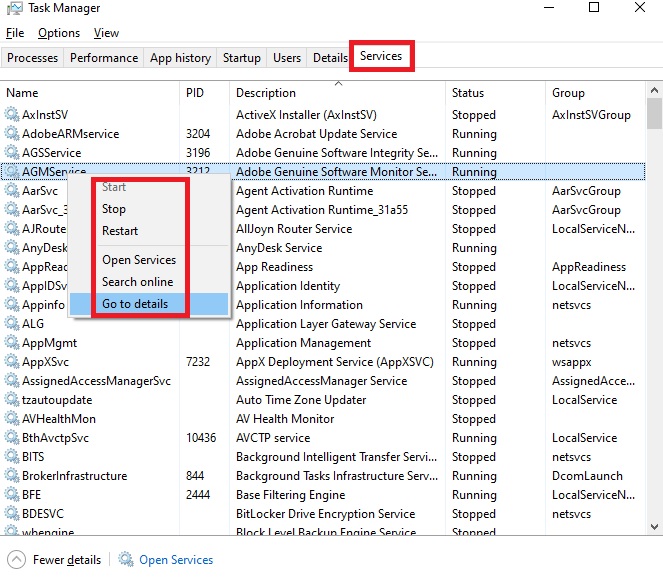
The Services Tab
Finally, the Services tab of the Task Manager will offer you the following options when you right-click on any one of the listed services:
- Start
- Stop
- Restart
- Open Services
- Search online
- Go to details
However, the columns of this specific tab in the Task Manager, unlike the other tabs in it, are preset and therefore cannot be altered. These columns include:
- Name
- PID
- Description
- Status
- Group
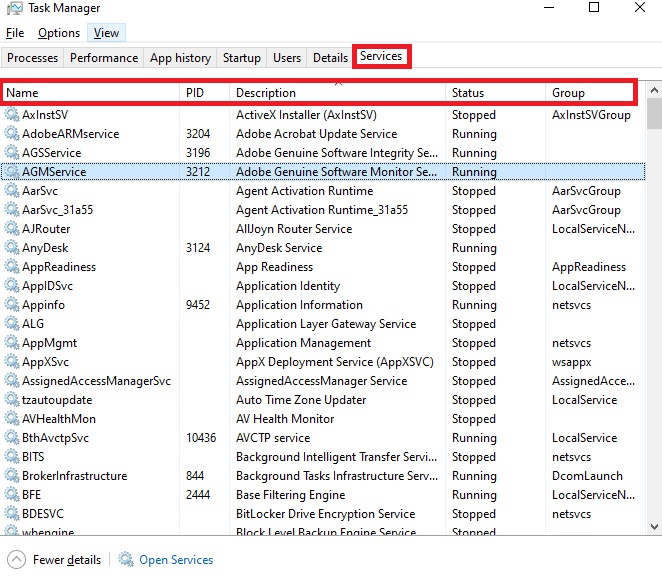
However, you can rearrange the columns by clicking and dragging them to the location you want.
Please be informed that every version of the Windows operating system may not show everything that is mentioned above.
Conclusion
The Task Manager is a powerful tool that provides detailed information and statistics about the various apps and processes running on a PC.
It displays information on the CPU, GPU, main system memory, network, and disks, as well as the apps that start when the PC is turned on.
The details shown by this tool help determine the resource used by each process and judge the overall health and performance of the PC.
With ten tabs in total, including three main menu tabs and seven additional tabs, the Task Manager offers a diverse set of information.
It is a useful tool for users to monitor and manage their PC’s resources effectively.